Difference between revisions of "Graph"
Jump to navigation
Jump to search
Paul Chapman (talk | contribs) (Created page with "==The graph control== ===Single Y-Axis Graphs=== right|750px|Frame|Single Y-Axis Graph Configuration Panel {| class="wikitable" style="text-align: left; ...") |
Paul Chapman (talk | contribs) |
||
| (38 intermediate revisions by the same user not shown) | |||
| Line 1: | Line 1: | ||
| − | == | + | ==Configuration== |
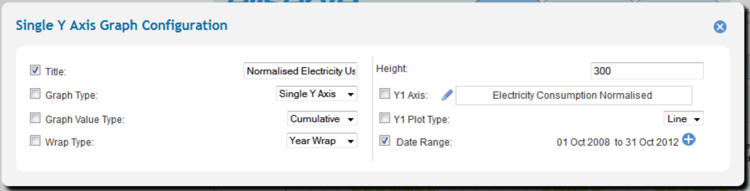
===Single Y-Axis Graphs=== | ===Single Y-Axis Graphs=== | ||
[[File:SingleY1.png|right|750px|Frame|Single Y-Axis Graph Configuration Panel]] | [[File:SingleY1.png|right|750px|Frame|Single Y-Axis Graph Configuration Panel]] | ||
| Line 5: | Line 5: | ||
!Width="100" Align="Center"|'''Purpose ''' | !Width="100" Align="Center"|'''Purpose ''' | ||
| | | | ||
| − | :To chart a single [[ | + | :To chart a single [[Time Series Data|time series data value]]. |
|- | |- | ||
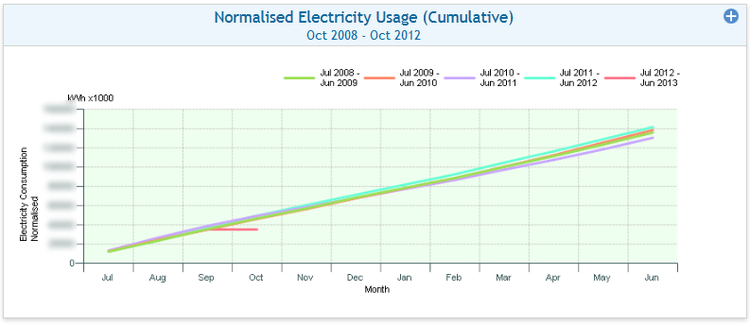
!'''Example ''' | !'''Example ''' | ||
| Line 18: | Line 18: | ||
|- | |- | ||
| | | | ||
| − | :''' | + | :'''Title''' |
| | | | ||
| − | :[[ | + | :[[Control Title Configuration|Graph display title]] |
| | | | ||
:Custom | :Custom | ||
| Line 27: | Line 27: | ||
:'''Graph type''' | :'''Graph type''' | ||
| | | | ||
| − | : Determines | + | : Determines the type of chart displayed |
| | | | ||
:Single Y-Axis | :Single Y-Axis | ||
| Line 57: | Line 57: | ||
:'''Y-Axis value type''' | :'''Y-Axis value type''' | ||
| | | | ||
| − | :[[ | + | :[[Monthly Value Picker|Value to be charted]] |
| | | | ||
| − | :[[ | + | :[[Time Series Data|All time series data values]] |
|- | |- | ||
| | | | ||
| Line 74: | Line 74: | ||
: Reporting time period | : Reporting time period | ||
| | | | ||
| − | :[[ | + | :[[Date Picker Configuration|Date range from date picker]] |
|} | |} | ||
''Note: To make a parameter available for in-session setting, check the box to the left of the setting parameter. | ''Note: To make a parameter available for in-session setting, check the box to the left of the setting parameter. | ||
| − | [[ | + | [[Configuring Ellserve|Parent]] - [[Ellserve:Ellserve|Home]] |
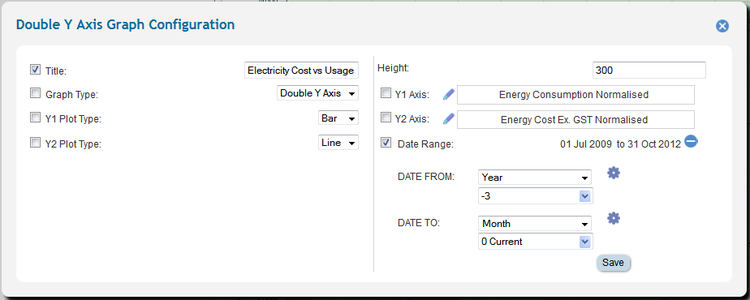
===Double Y-Axis Graphs=== | ===Double Y-Axis Graphs=== | ||
| Line 86: | Line 86: | ||
!Width="100" Align="Center"|'''Purpose ''' | !Width="100" Align="Center"|'''Purpose ''' | ||
| | | | ||
| − | :To chart two [[ | + | :To chart two [[Time Series Data|time series data values]] of the same or different units against each other. |
|- | |- | ||
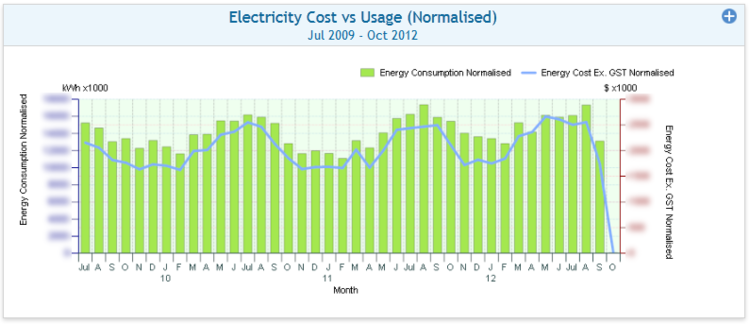
!'''Example ''' | !'''Example ''' | ||
| Line 99: | Line 99: | ||
|- | |- | ||
| | | | ||
| − | :''' | + | :'''Title''' |
| | | | ||
| − | :[[ | + | :[[Control Title Configuration|Graph display title]] |
| | | | ||
:Custom | :Custom | ||
| Line 108: | Line 108: | ||
:'''Graph type''' | :'''Graph type''' | ||
| | | | ||
| − | : Determines | + | : Determines the type of chart displayed |
| | | | ||
:Double Y-Axis | :Double Y-Axis | ||
| Line 138: | Line 138: | ||
:'''Y1-Axis value type''' | :'''Y1-Axis value type''' | ||
| | | | ||
| − | :[[ | + | :[[Monthly Value Picker|Value to be charted]] on the 1<sup>st</sup> Y-Axis |
| | | | ||
| − | :[[ | + | :[[Time Series Data|All time series data values]] |
|- | |- | ||
| | | | ||
:'''Y2-Axis value type''' | :'''Y2-Axis value type''' | ||
| | | | ||
| − | :[[ | + | :[[Monthly Value Picker|Value to be charted]] on the 2<sup>nd</sup> Y-Axis |
| | | | ||
| − | :[[ | + | :[[Time Series Data|All time series data values]] |
|- | |- | ||
| | | | ||
| Line 154: | Line 154: | ||
: Reporting time period | : Reporting time period | ||
| | | | ||
| − | :[[ | + | :[[Date Picker Configuration|Date range from date picker]] |
|} | |} | ||
| + | <span style="color: red;"> | ||
| + | '''Tip: If using a double Y-Axis graph to chart values of the same unit take care when comparing the two plots as they could have different scales depending on how each axis has been rendered.''' | ||
| + | </Span> | ||
| − | + | [[Configuring Ellserve|Parent]] - [[Ellserve:Ellserve|Home]] | |
| − | |||
| − | |||
| − | |||
| − | |||
| − | [[ | ||
===Unit Graphs=== | ===Unit Graphs=== | ||
| Line 170: | Line 168: | ||
!Width="100" Align="Center"|'''Purpose ''' | !Width="100" Align="Center"|'''Purpose ''' | ||
| | | | ||
| − | :To chart mutiple [[ | + | :To chart mutiple [[Time Series Data|time series data values]] of the same units against each other. |
|- | |- | ||
!'''Example ''' | !'''Example ''' | ||
| Line 183: | Line 181: | ||
|- | |- | ||
| | | | ||
| − | :''' | + | :'''Title''' |
| | | | ||
| − | :[[ | + | :[[Control Title Configuration|Graph display title]] |
| | | | ||
:Custom | :Custom | ||
| Line 192: | Line 190: | ||
:'''Graph type''' | :'''Graph type''' | ||
| | | | ||
| − | : Determines | + | : Determines the type of chart displayed |
| | | | ||
:Unit | :Unit | ||
| Line 211: | Line 209: | ||
:'''Monthly values''' | :'''Monthly values''' | ||
| | | | ||
| − | :[[ | + | :[[Monthly Value Picker|Values to be charted]] |
| | | | ||
| − | :[[ | + | :[[Time Series Data|All time series data values]] sharing the selected graphing unit |
|- | |- | ||
| | | | ||
| Line 243: | Line 241: | ||
: Reporting time period | : Reporting time period | ||
| | | | ||
| − | :[[ | + | :[[Date Picker Configuration|Date range from date picker]] |
|} | |} | ||
| + | <span style="color: red;"> | ||
| + | '''Tip: When configuring a unit chart take care to choose values that make sense, for example accumulated unit cost has no meaning.''' | ||
| + | </Span> | ||
| − | + | [[Configuring Ellserve|Parent]] - [[Ellserve:Ellserve|Home]] | |
| − | |||
| − | [[ | ||
===Pie Graphs=== | ===Pie Graphs=== | ||
| Line 256: | Line 255: | ||
!Width="100" Align="Center"|'''Purpose ''' | !Width="100" Align="Center"|'''Purpose ''' | ||
| | | | ||
| − | :To chart accumulated [[ | + | :To chart accumulated [[Time Series Data|time series data values]] for a single data item by a reporting category. |
|- | |- | ||
!'''Example ''' | !'''Example ''' | ||
| Line 269: | Line 268: | ||
|- | |- | ||
| | | | ||
| − | :''' | + | :'''Title''' |
| | | | ||
| − | :[[ | + | :[[Control Title Configuration|Graph display title]] |
| | | | ||
:Custom | :Custom | ||
| Line 278: | Line 277: | ||
:'''Graph type''' | :'''Graph type''' | ||
| | | | ||
| − | : Determines | + | : Determines the type of chart displayed |
| | | | ||
:Pie | :Pie | ||
| Line 292: | Line 291: | ||
:'''Monthly values''' | :'''Monthly values''' | ||
| | | | ||
| − | :[[ | + | :[[Monthly Value Picker|Values to be charted]] |
| | | | ||
| − | :[[ | + | :[[Time Series Data|All time series data values]] sharing the selected graphing unit |
|- | |- | ||
| | | | ||
| Line 304: | Line 303: | ||
|- | |- | ||
| | | | ||
| − | :'''Category | + | :'''Category Type''' |
| | | | ||
:Determines the reporting category will be used to slice up the pie. | :Determines the reporting category will be used to slice up the pie. | ||
| Line 316: | Line 315: | ||
: Reporting time period | : Reporting time period | ||
| | | | ||
| − | :[[ | + | :[[Date Picker Configuration|Date range from date picker]] |
|} | |} | ||
| Line 322: | Line 321: | ||
''Note: When filtering down to a small number of accounts the pie chart may contain only one slice. | ''Note: When filtering down to a small number of accounts the pie chart may contain only one slice. | ||
| − | [[Ellserve:Configuring Ellserve| | + | [[Configuring Ellserve|Parent]] - [[Ellserve:Ellserve|Home]] |
| + | |||
| + | |||
| + | ==Usage== | ||
| + | Graphs have no interactive usage features. | ||
| + | |||
| + | [[Configuring Ellserve|Parent]] - [[Ellserve:Ellserve|Home]] | ||
Latest revision as of 12:39, 3 October 2013
Configuration
Single Y-Axis Graphs

| Purpose |
|
|---|---|
| Example |
|

| Settings | Description | Values |
|---|---|---|
|
| |
|
|
|
|
|
|
|
|
|
|
|
|
|
||
|
|
|
|
|
Note: To make a parameter available for in-session setting, check the box to the left of the setting parameter.
Double Y-Axis Graphs

| Purpose |
|
|---|---|
| Example |
|

| Settings | Description | Values |
|---|---|---|
|
| |
|
|
|
|
|
|
|
|
|
|
|
|
|
|
|
|
|
|
|
|
Tip: If using a double Y-Axis graph to chart values of the same unit take care when comparing the two plots as they could have different scales depending on how each axis has been rendered.
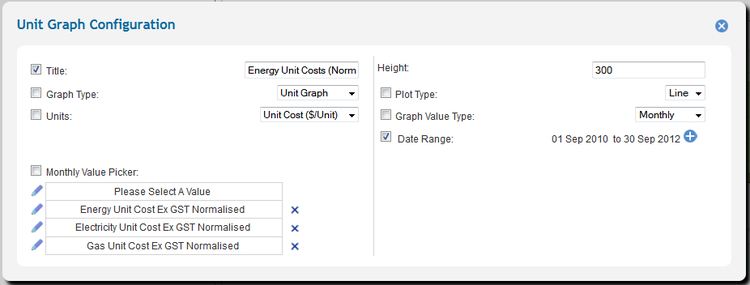
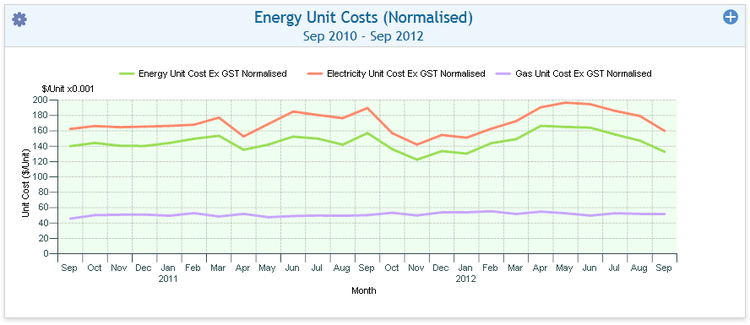
Unit Graphs

| Purpose |
|
|---|---|
| Example |
|

| Settings | Description | Values |
|---|---|---|
|
| |
|
|
|
|
|
|
|
| |
|
|
|
|
|
|
|
|
|
|
|
Tip: When configuring a unit chart take care to choose values that make sense, for example accumulated unit cost has no meaning.
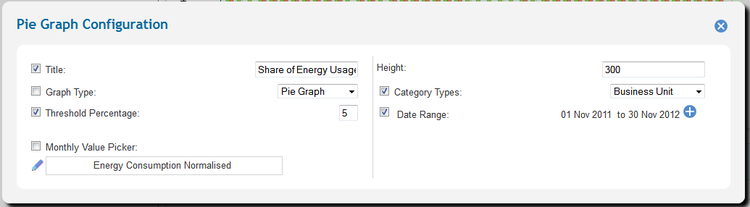
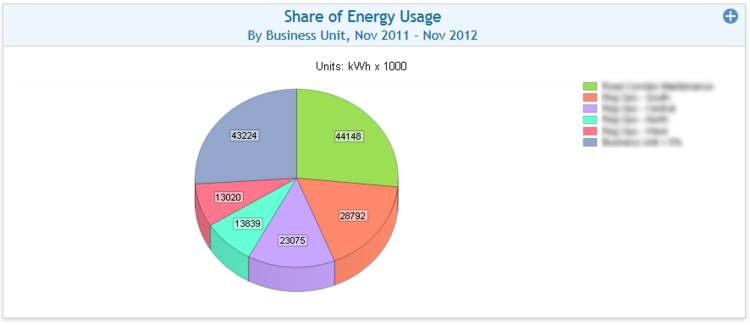
Pie Graphs

| Purpose |
|
|---|---|
| Example |
|

| Settings | Description | Values |
|---|---|---|
|
| |
|
|
|
|
|
|
|
| |
|
|
|
|
|
|
|
|
Note: When filtering down to a small number of accounts the pie chart may contain only one slice.
Usage
Graphs have no interactive usage features.