Access
Cost details for a Commodity are accessed through the "<Commodity> Cost" Tab on the carousel.
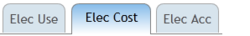
Monthly Cost Trends - Single Commodity
| Object type
|
- Single Y-axis chart
|
| Purpose
|
- To highlight trends in the cost profile for one or more sites by comparing year-on-year accumulated monthly cost totals.
|
| Defaults
|
|
| Reporting interval
|
- Monthly (accumulated annually)
|
| Plot type
|
- Line
|
| Dates
|
- Relative
|
| Start date
|
- Current year -3
|
| End date
|
- Current month
|
| Configurable in session
|
- Start date
|
- End date
|
Parent - Standard Configuration - Home
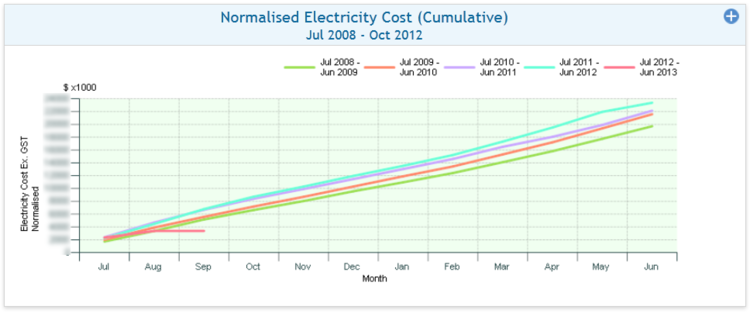
Monthly Consumption vs Cost - Single Commodity
| Object type
|
- Double Y-axis chart
|
| Purpose
|
- To compare how normalised monthly consumption tacks against cost over the same period for one or more sites - single Commodity.
|
| Defaults
|
|
| Reporting interval
|
- Monthly totals
|
| Plot type
|
- Bar and line
|
| Dates
|
- Relative
|
| Start date
|
- Current year -3
|
| End date
|
- Current month
|
| Configurable in session
|
- Start date
|
- End date
|
Parent - Standard Configuration - Home
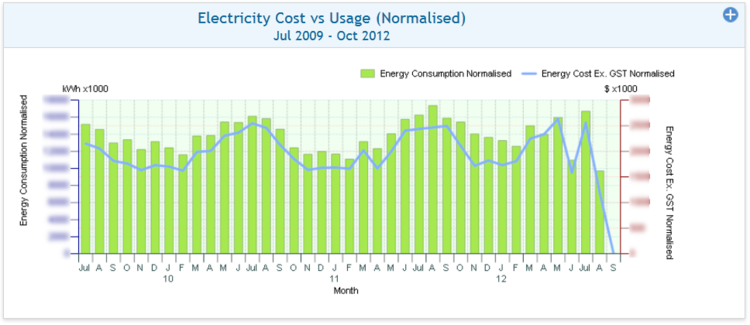
Monthly Projected vs Budgeted Costs - Single Commodity
| Object Type
|
- Single Value Chart
|
| Purpose
|
- To highlight variance between projected and budgeted cost profiles for one or more sites.
|
| Defaults
|
|
| Reporting interval
|
- Monthly
|
| Plot type
|
- Line
|
| Dates
|
- Relative
|
| Start date
|
- Current year -4
|
| End date
|
- Current month +18
|
| Configurable in session
|
- Start date
|
- End date
|
Note: Projected costs are equal to actual (normalised) costs for historical periods with complete cost history.
Parent - Standard Configuration - Home
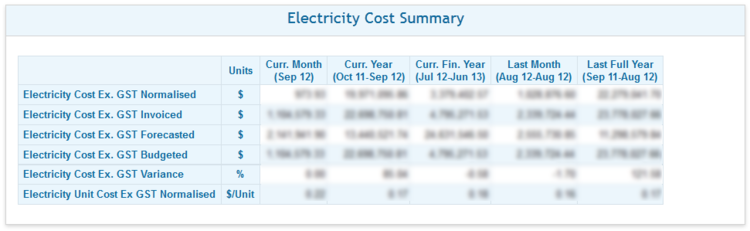
Cost Summary Table - Single Commodity
| Object Type
|
- Summary Table
|
| Purpose
|
- To summarise and compare normalised cost data for a single commodity by commonly used time periods.
|
| Defaults
|
|
| Reporting intervals
|
- Current (calendar) Month
- Current year (previous 11 calendar months and Current month)
- Current financial year (financial year to date)
- Last month (previous calendar month)
- Last Full Year (previous 12 calendar months)
|
| Reporting Items
|
- Total commodity normalised cost
- Total Commodity Invoiced Cost
- Total commodity forecast cost
- Total commodity budgeted cost
- Commodity cost variance (percentage difference between actual and projected values)
- Commodity unit cost ($/consumption Unit)
|
| Configurable in session
|
- None
|
Parent - Standard Configuration - Home
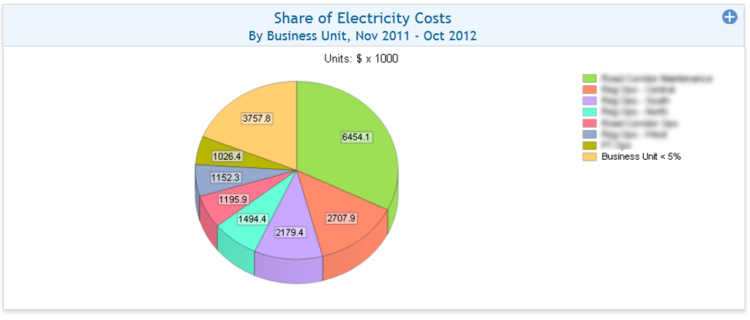
Share of Costs by Category - Single Commodity
| Object Type
|
- Pie Chart
|
| Purpose
|
- To chart how a commodity's cost is shared across a category.
|
| Defaults
|
|
| Reporting interval
|
- Annually
|
| Plot type
|
- Pie
|
| Dates
|
- Relative
|
| Start date
|
- Current month -13
|
| End date
|
- Current month -1
|
| Category
|
- Business Unit
|
| Threshold
|
- %
|
| Configurable in session
|
- Start date
|
- End date
|
- Category
|
- Threshold
|
Parent - Standard Configuration - Home
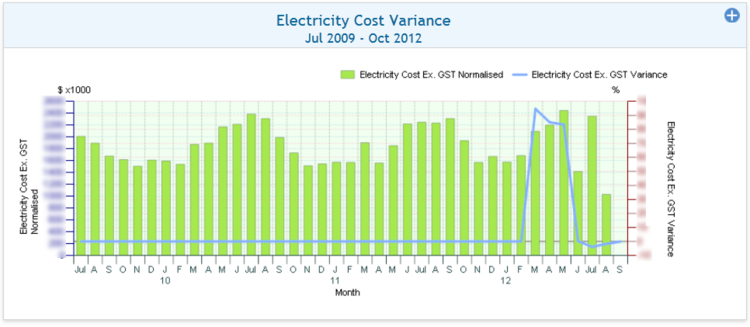
Monthly Cost vs Forecast Variance - Single Commodity
| Object type
|
- Double Y-axis chart
|
| Purpose
|
- To compare monthly normalised cost to the percentage variance between actual and forecast cost - single Commodity.
|
| Defaults
|
|
| Reporting interval
|
- Monthly totals
|
| Plot type
|
- Bar and line
|
| Dates
|
- Relative
|
| Start date
|
- Current year -2
|
| End date
|
- Current month
|
| Configurable in session
|
- Start date
|
- End date
|
Parent - Standard Configuration - Home
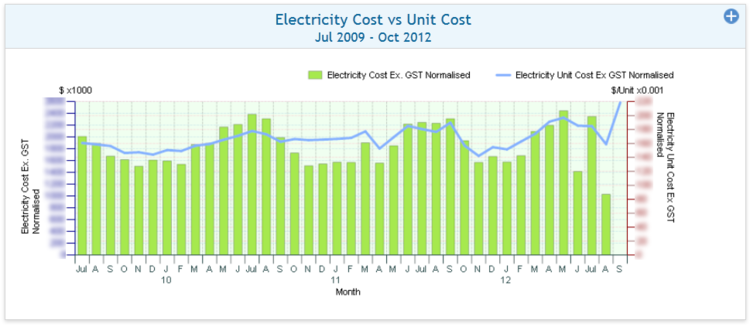
Monthly Normalised Cost vs Unit Cost - Single Commodity
| Object type
|
- Double Y-axis chart
|
| Purpose
|
- To compare monthly normalised cost to unit cost for one or more sites - single Commodity.
|
| Defaults
|
|
| Reporting interval
|
- Monthly totals
|
| Plot type
|
- Bar and line
|
| Dates
|
- Relative
|
| Start date
|
- Current year -3
|
| End date
|
- Current month
|
| Configurable in session
|
- Start date
|
- End date
|
Parent - Standard Configuration - Home
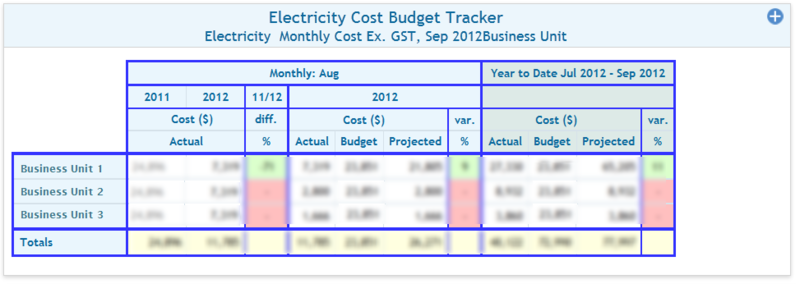
Usage Tracking Table - Single Commodity
| Object Type
|
- Tracking Table
|
| Purpose
|
- To highlight variances between actual and expected costs for a single commodity over commonly used time periods.
|
| Defaults
|
|
| Reporting intervals
|
- Single Month
- Current financial year (Financial year to date)
|
| Reporting Items
|
- Total commodity normalised monthly cost as at 13 months previous
- Total commodity normalised monthly cost in previous month (current -1)
- Percentage normalised monthly cost difference between that in previous month and that a year earlier.
- Total commodity normalised (actual) monthly cost in previous month
- Total commodity forecast (budget) monthly cost in previous month
- Total commodity expected (projected) monthly cost in previous month
- Variance (percentage difference) between expected and forecast Cost in previous month
- Commodity Cost Variance (percentage difference between actual and projected values) in previous month
- Total commodity forecast (budget) monthly cost in financial year to date
- Total commodity expected (projected) monthly cost in financial year to date
- Variance (percentage difference) between expected and forecast Cost in financial year to date
- Commodity cost variance (percentage difference between actual and projected values) in financial year to date
|
| Category
|
- Business Unit
|
| Highlight Threshold
|
- 5%
|
| Configurable in session
|
- Start date
|
- End date
|
- Highlight threshold
|
- Reporting period (month or quarter)
|
- Category
|
Note: The highlight threshold sets the value over which a variance or difference is highlighted in the table.
* Cells containing negative differences (i.e. cost has fallen) are shaded green, positive differences are shaded red
* Cells containing negative variances (i.e. Cost is higher than forecast) are shaded red, positive differences are shaded green
Note: By default the tracker uses forecast data from a budget where one has been defined.  In this case tracking takes place against
forecast data that is fixed over the time frame of the budget.  Where no budget has been defined, the tracker reports difference and
variance against system generated forecast data.  Forecast data is periodically regenerated as new consumption data is received.
This means, where no budget has been fixed, subtle month by month changes in variance data may be noted (occurring mostly in the current quarter).
Parent - Standard Configuration - Home
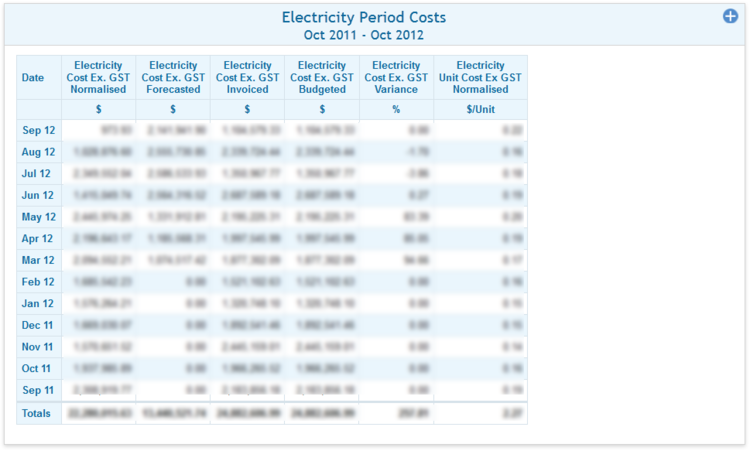
Normalised Cost - Single Commodity by Period
| Object Type
|
- Data table
|
| Purpose
|
- To summarise and compare total monthly cost over the previous year - single Commodity.
|
| Defaults
|
|
| Reporting intervals
|
- Month
|
| Reporting items
|
- Total commodity normalised cost
- Total commodity forecast cost
- Total commodity invoiced cost
- Total commodity budgeted cost
- Commodity cost variance (percentage difference between actual and projected values)
- Commodity unit cost ($/consumption unit)
|
| Configurable in session
|
- Start date
|
- End date
|
Parent - Standard Configuration - Home