Access
The Emissions Page is accessed through the tC02e tab on the carousel
Parent - Standard Configuration - Home
Controls
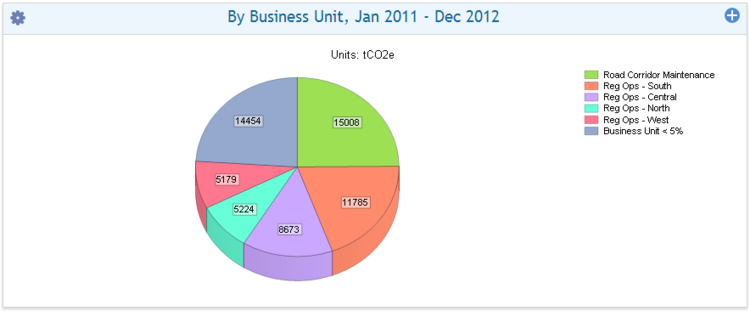
Monthly Emissions by Business Unit
| Object type
|
- Pie chart
|
| Purpose
|
- To summarise normalised monthly Emissions by Business Unit.
|
| Defaults
|
|
- Reporting interval
|
- Monthly
|
- Plot Type
|
- Pie
|
- Dates
|
- Relative
|
- Start Date
|
- Current month -12
|
- End date
|
- Current month
|
| Configurable in session
|
- Start date
|
- End date
|
- Threshold Percentage
|
Parent - Standard Configuration - Home
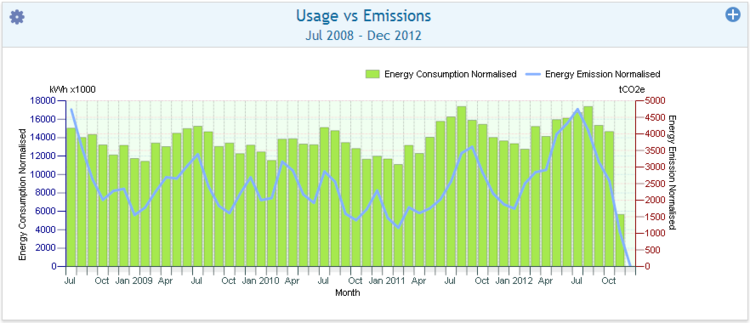
Usage vs. Emissions
| Object type
|
- Double Y-axis chart
|
| Purpose
|
- To compare how normalised monthly consumption tracks against emissions over the same period for one or more sites.
|
| Defaults
|
|
- Reporting interval
|
- Monthly
|
- Plot Type
|
- Bar and Line
|
- Dates
|
- Relative
|
- Start Date
|
- Current year -3
|
- End date
|
- Current month
|
| Configurable in session
|
- Start date
|
- End date
|
- Graph type
|
- Plot type
|
- Y1 axis 1 variable
|
- Y1 axis 1 plot type
|
- Y1 axis 2 variable
|
- Y1 axis 2 plot type
|
Parent - Standard Configuration - Home
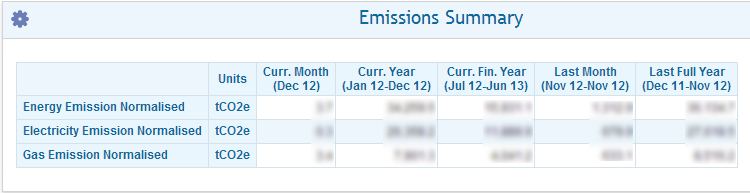
Summary
| Object type
|
- Summary table
|
| Purpose
|
- To compare normalised emissions from various sources over yearly and monthly periods.
|
| Defaults
|
|
- Reporting interval
|
- Monthly/Annually
|
- Dates
|
- Relative
|
- Start Date
|
- Start of Last Full Year
|
- End date
|
- Current month
|
| Configurable in session
|
- Title
|
- Value Types
|
- Periods
|
Parent - Standard Configuration - Home
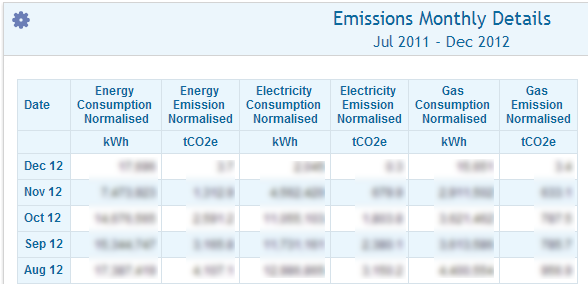
Monthly Details
| Object type
|
- Summary table
|
| Purpose
|
- To provide normalised monthly data for the comparison of Consumption vs. Emissions
|
| Defaults
|
|
- Reporting interval
|
- Monthly
|
- Dates
|
- Relative
|
- Start Date
|
- Start of Last Full Financial Year
|
- End date
|
- Current month
|
| Configurable in session
|
- Title
|
- Frequency of Data (ie. Monthly, Quarterly, Annually)
|
- Value Types
|
- Date Range
|
Parent - Standard Configuration - Home