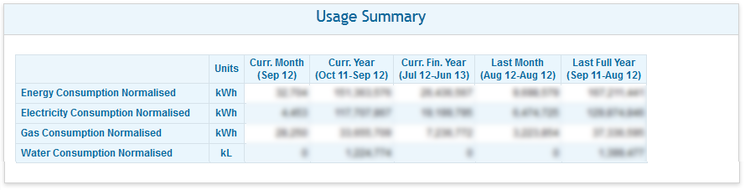
The usage summary is accessed through the "Usage" tab on the carousel and provides a single location to summarise consumption across all commodities.
Normalised Usage Summary Table - All Commodities
| Object type
|
- Summary table
|
| Purpose
|
- To summarise latest total consumption for each commodity (or group) by commonly used time periods.
|
| Defaults
|
|
- Reporting intervals
|
- Current (calendar) month
- Current year (previous 11 calendar months and current month)
- Current financial year (financial year to date)
- Last month (previous calendar month)
- Last full year (previous 12 calendar months)
|
- Reporting items
|
- Total consumption for commodity (or commodity group)
|
| Configurable in session
|
- None
|
Parent - Standard Configuration - Home
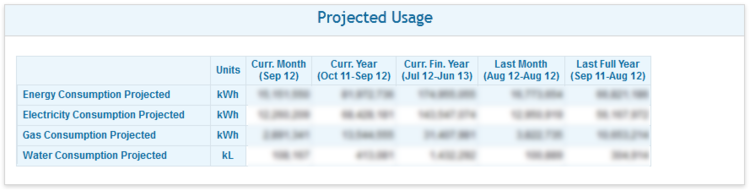
Projected Usage Summary Table - All Commodities
| Object Type
|
- Summary Table
|
| Purpose
|
- To summarise total projected usage for each commodity (or group) by commonly used time periods. Useful for identifying where actual consumption differs from expected consumption.
|
| Defaults
|
|
- Reporting intervals
|
- Current (calendar) Month
- Current year (previous 11 calendar months and current month)
- Current financial year (financial year to date)
- Last month (previous calendar month)
- Last full year (previous 12 calendar months)
|
- Reporting items
|
- Total projected consumption for commodity (or commodity group)
|
- Configurable in session
|
- None
|
Parent - Standard Configuration - Home
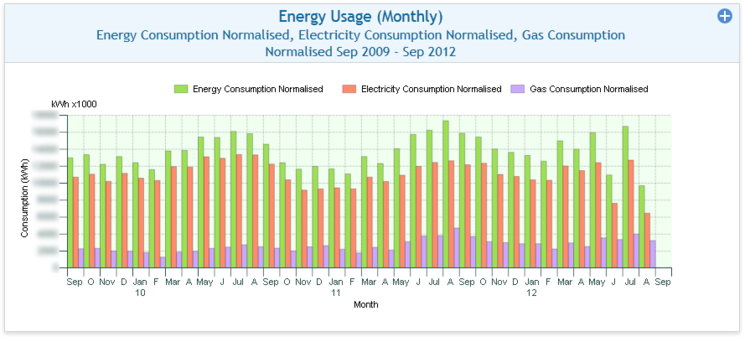
Monthly Commodity Group Usage
| Object Type
|
- Unit chart
|
| Purpose
|
- To chart monthly consumption by commodity for a commodity group.
|
| Defaults
|
|
- Reporting interval
|
- Monthly
|
- Plot Type
|
- Bar
|
- Dates
|
- Relative
|
- Start date
|
- Current month -48
|
- End date
|
- Current month
|
| Configurable in session
|
- Start date
|
- End date
|
Parent - Standard Configuration - Home
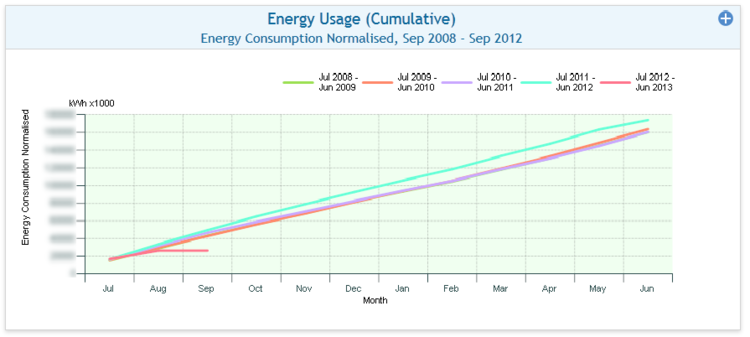
Monthly Consumption Trends by Commodity Group
| Object Type
|
- Unit chart
|
| Purpose
|
- To summarise monthly consumption trends by commodity type for a commodity group.
|
| Defaults
|
|
- Reporting interval
|
- Monthly (accumulated annually by financial year)
|
- Plot type
|
- Line
|
- Dates
|
- Relative
|
- Start date
|
- Current month -48
|
- End date
|
- Current month
|
| Configurable in session
|
- Start date
|
- End date
|
Parent - Standard Configuration - Home
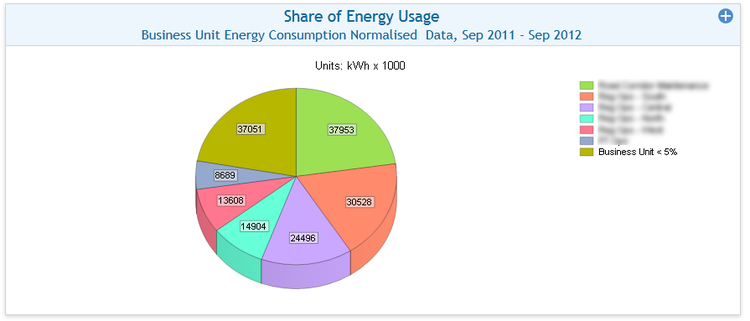
Share of Usage for a Commodity Group
| Object yype
|
- Pie Chart
|
| Purpose
|
- To chart how commodity group consumption is shared across a category.
|
| Defaults
|
|
- Reporting interval
|
- Annual
|
- Plot type
|
- Pie
|
- Dates
|
- Relative
|
- Category
|
- Business unit
|
- Threshold
|
- 5%
|
| Configurable in session
|
- Start date
|
- End date
|
- Category
|
- Threshold
|
Parent - Standard Configuration - Home
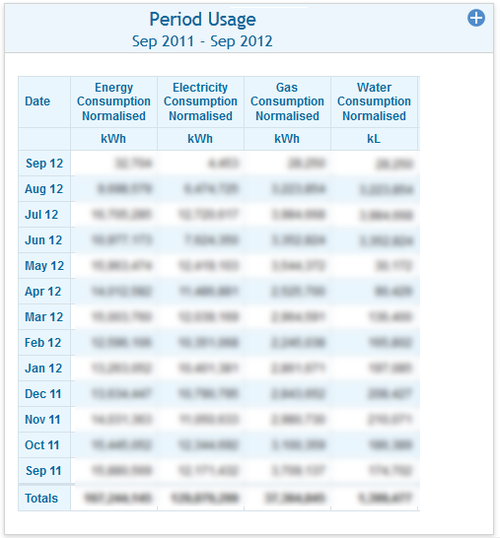
Period Normalised Usage All Commodities
| Object Type
|
- Data table
|
| Purpose
|
- To summarise total consumption (by month or other period) for the previous year by commodity.
|
| Defaults
|
|
- Reporting intervals
|
- Month
|
- Reporting items
|
- Total period normalised consumption for commodity
|
- Start date
|
- Current year -1
|
- End date
|
- Current month +2
|
- Start date
- Configurable in session
|
- End date
|
Parent - Standard Configuration - Home